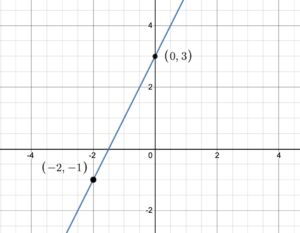
When an equation is written in the form [latex]y = mx+b[/latex] it is said to be in slope-intercept form. Let’s see why it has that name. Consider the equation [latex]y=2x+3[/latex]. If we set [latex]x=0[/latex], then [latex]y=2(0)+3=3[/latex]. This means that the point [latex](0, 3)[/latex] is the [latex]y[/latex]-intercept of the line formed by the equation.
Figure 1. Graph of [latex]y=2x+3[/latex]
The graph in figure 1, also shows that the point [latex](-2 -1)[/latex] lies on the graph. Consequently, the slope of the line is [latex]m=\frac=\frac=\frac=2[/latex]. This is the coefficient of [latex]x[/latex] in the equation [latex]y=2x+3[/latex]. So with slope = [latex]m[/latex] and the [latex]y[/latex]-intercept [latex]= (0, b)[/latex], the equation written in the form [latex]y=mx+b[/latex] immediately tells us the slope, [latex]m[/latex], and the [latex]y[/latex]-intercept, [latex](0, b)[/latex].
In the equation [latex]y=mx+b[/latex],
Find the slope and [latex]y[/latex]-intercept of the line with the given equation:
3. We first have to rearrange the equation to solve for [latex]y[/latex]:
Find the slope and [latex]y[/latex]-intercept of the line with the given equation:
Show Answer3. We first have to rearrange the equation to solve for [latex]y[/latex]:
We can also find the linear equation that represents te graph of a line If we know the slope and the [latex]y[/latex]-intercept.
Write the equation of the line that has a slope of [latex] \displaystyle \frac[/latex] and a y-intercept of [latex](0, −5)[/latex].
Substitute the slope, [latex]m[/latex], into [latex]y=mx+b[/latex].
[latex] \displaystyle y=\fracx+b[/latex]
Substitute [latex]b[/latex], into the equation.
[latex] \displaystyle y=\fracx-5[/latex]
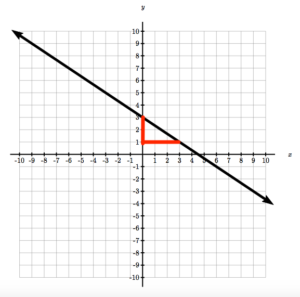
Write the equation of the line in the graph by identifying the slope and [latex]y[/latex]-intercept.
 Solution
Identify the point where the graph crosses the [latex]y[/latex]-axis [latex](0,3)[/latex]. This means that [latex]b=3[/latex]. Identify one other point and draw a slope triangle to find the slope.
Substitute [latex]m[/latex] and [latex]b[/latex] into the slope-intercept equation.
When we are given an equation in the slope-intercept form of [latex]y=mx+b[/latex], we can identify the slope and y-intercept and use these to graph the equation. When we have an equation in slope-intercept form we can graph it by first plotting the [latex]y[/latex]-intercept, then using the slope to find a second point, and connecting the dots.
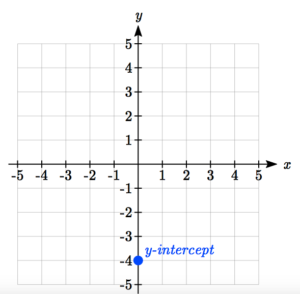
Graph [latex]y=\fracx-4[/latex] using the slope-intercept equation.
First, plot the [latex]y[/latex]-intercept.
Now use the slope to count up or down and over left or right to the next point. This slope is [latex]\frac[/latex], so we can count up one and right two—both positive because both parts of the slope are positive.
Connect the dots.

NOTE: it is important for the equation to first be in slope-intercept form. If it is not, we have to solve it for [latex]y[/latex] so we can identify the slope and the [latex]y[/latex]-intercept.
Watch the video below for another example of how to write the equation of the line, when given a graph, by identifying the slope and y-intercept.